Online Estate Agent Statistics & Market Share
Market Share
Between Online Estate Agents
| Online Agent | Property Listings | Market Share |
|---|---|---|
|
Purplebricks |
16,801 | 53.01% |
|
Strike Estate Agents |
4,887 | 15.42% |
|
YOPA |
3,612 | 11.4% |
|
Express Estate Agency |
2,563 | 8.09% |
|
99Home |
567 | 1.79% |
|
Springbok Properties |
430 | 1.36% |
|
Open House |
329 | 1.04% |
|
Sellmyhome.co.uk |
326 | 1.03% |
|
Emoov |
323 | 1.02% |
|
SOLD.CO.UK |
237 | 0.75% |
|
easyProperty |
184 | 0.58% |
|
Property Eagle |
155 | 0.49% |
|
Truuli |
144 | 0.45% |
|
Griffin Property Co |
132 | 0.42% |
|
Harding Estate Agents |
120 | 0.38% |
|
iMOVEHOME |
118 | 0.37% |
|
Findahome Online |
102 | 0.32% |
|
EweMove |
102 | 0.32% |
|
eSale |
93 | 0.29% |
|
My Online Estate Agent |
91 | 0.29% |
|
Bettermove |
87 | 0.27% |
|
agentonline.co.uk |
70 | 0.22% |
|
Pink Street |
63 | 0.2% |
|
I Am The Agent |
54 | 0.17% |
|
Visum |
45 | 0.14% |
|
Scottish House Move |
23 | 0.07% |
|
The Agency UK |
19 | 0.06% |
|
MoveOn Estate Agents |
18 | 0.06% |
|
OnlineEstateAgents.com |
1 | 0% |
Online Agents Vs High Street Agents
Online estate agents' growth in cumulative market share has plateaued somewhat since 2018, and it is generally reported that they command around a tenth of the market.
Our research shows online estate agents' market share is 8.94 %.
This figure is calculated using the number of active estate agent listings, i.e. properties sold subject to contract (STC) are not included.
For a more in-depth look at recent trends, please see the below section on the Impact of Coronavirus on online estate agents' market share.
Impact of Coronavirus (COVID-19) on online estate agents' market share (2020)
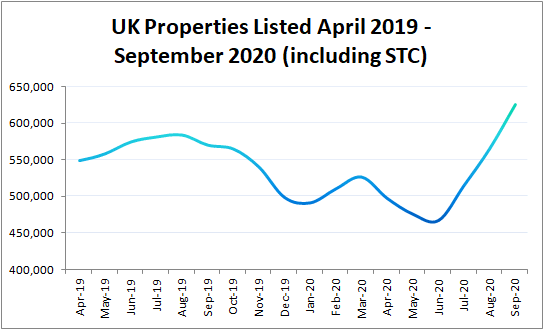
The total number of UK properties listed on property portals (including those by high street agents) took a significant dip in April. As can be seen in the below graph, the number of properties listed fell around 60,000 (12%) from March to June (the trough), with a recovery, in terms of volume, currently underway since July to present (September 2020 as of writing). Comparing like with like, the number of properties listed in June 2020 was 19% less than the 2019 figure. In contrast, the number of properties listed in September 2020 is 10% higher than in September 2019, indicating some pent-up supply in the property market.
The effect on exclusively online estate agents' listing numbers can be seen in the following graph.
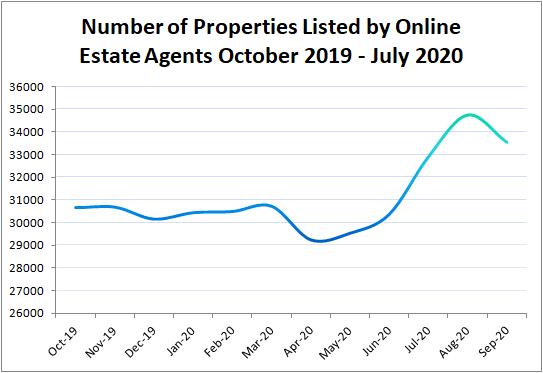
Comparing the above two graphs, you can see that online estate agents' listings appear to have contracted more sharply compared to the property industry as a whole, with a low-point in April 2020, compared to June 2020 for the overall industry. In terms of severity, listings reduced 4.8%, compared with a 12% reduction for the overall market. Indeed, online estate agents appeared to be gaining in the climate by June, and the number of properties listed by online estate agents was higher in August than at any point since we started recording in late 2019.
In September, there are now fewer properties marketed by online estate agents compared to August, but still more than any other month since we started recording in 2019. However, as this dip coincides with the overall market seeing a large rebound in activity, online estate agents' current market share has actually taken a hit despite overall growth in raw numbers.
The below graph shows the market share of online estate agents over time as a percentage:
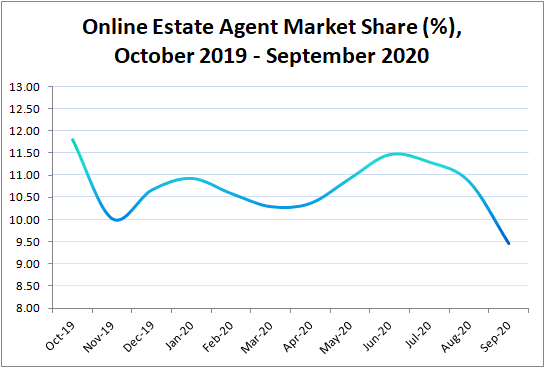
The deviations shown in the above graph are not at all conclusive by themselves, but it is possible to speculate that online estate agents become relatively more attractive in light of social distancing measures, which could dampen the attractiveness of high-street features like hosted viewings. The potential savings offered by online estate agents may also become more important as the population tightens its belt.
It is also worthwhile noting that the application and lifting of Lockdown measures appeared to affect online estate agents' number of listings quicker and more sharply than the overall market, suggesting that online agents' trends may be useful as a predictor.
Average Prices & Fees
Average Asking Price in the UK
The average asking price for a property listed with an online agent is £281,949. This matches closely to the UK average price paid of £278,787.[1]
Bear in mind that the 'mean average' will be skewed upward by very expensive properties. The median price paid, i.e. the 50th percentile, is lower. In England and Wales, it is £235,000, according to the Office for National Statistics.[2]
Average Online Agent Fee
The average fee you can expect to pay depends heavily what package and services you're looking for. We've collated similar types of packages offered by agents to help you see what you can expect:
| Package Type | Average Price |
|---|---|
| Basic (Listing Only, No Photos) | £229 |
| Standard (Includes Listing, Photography) | £557 |
| Hybrid (Self-Hosted Viewings) | £803 |
| Hybrid (Accompanied Viewings) | £1,168 |
Average Savings Vs High Street
Using the lower, median average selling price of £235,000, it's possible to estimate how much you stand to save using an online estate agent.
Traditional high street estate agents usually operate on a commission basis. There is a considerable range of commissions, ranging from about 0.75% to 3%. An independent body's research came across multiple suggested commission averages: 1.3%, 1.5% and 1.8%. All of these exclude VAT of 20%, so the true amount a seller pays is higher than the listed figure. We will use this range of figures, but including VAT, to calculate the savings.
| Online Agent Package Type | 0.75% + VAT | 1% + VAT | 1.25% + VAT | 1.5% + VAT | 1.75% + VAT | 2% + VAT |
|---|---|---|---|---|---|---|
| Basic (Listing Only, No Photos) (£229) | £1,886 | £2,591 | £3,296 | £3,991 | £4,706 | £5,411 |
| Standard (Listing, Photography) (£557) | £1,558 | £2,263 | £2,968 | £3,663 | £4,378 | £5,083 |
| Hybrid (Self-Hosted Viewings) (£803) | £1,312 | £2,017 | £2,722 | £3,417 | £4,132 | £4,837 |
| Hybrid (Accompanied Viewings) (£1,168) | £947 | £1,652 | £2,357 | £3,052 | £3,767 | £4,472 |
It is worth bearing in mind that the higher the listing price of the property, the more you stand to save. This means an online agent might save you £15,000 on a million pound property, but conversely, if you are selling a lower-priced property, the savings made from an online estate agent can narrow, and in some rare situations, become negative. For example, 1.25% + VAT commission on an £75,000 property is £1,125, which is not a considerably higher fee than some hybrid estate agents.
Data Accuracy
We do our utmost to ensure these statistics are correct using a variety of means, including manually checking the number of properties listed live on property portals and on agents' websites. We also keep these numbers up to date and the tables and graphs should not be out of date any more than a week.
There is however scope for for discrepancies between our data and other sources (e.g. TwentyCI) due to methodology differences. Potential differences in methodology with other sources are:
- Determination of market share — we use the proportion of live listings at any moment in time, while other sources have been known to use records of property exchanges, which gives a more historical snapshot and also usually covers only England and Wales
- Listing Status — For sources which also use listing, it's possible there are exclusions based on listing status. OnlineAgentPicker attempts to exclude listings that are sold Subject to Contract (STC).
- Determination of what constitutes an online estate agent — The line between online estate agents and traditional estate agents is becoming blurrier all the time, especially with the arrival of hybrid estate agents. OnlineAgentPicker tries to take a 'common sense' approach: if we don't think a customer would consider the agent an online estate agent, we won't either. Usually this boils down whether a customer is able to physically visit the agent 'on the high-street', and if they can, we usually do not consider the agent as 'online', as much as they may make extensive use of online marketing and adopt similar fee strategies. Other sources' definitions may be more inclusive in this respect. It is also the case that other sources can exclude certain types of online estate agents, such as fast sale specialists, or hybrids.
- It is possible that new online estate agents can go unaccounted for by us, although we do think this is rare. These agents automatically contribute as "high street" agents in the relevant sections, and are excluded from internal online estate agent comparisons. In contrast, it is not possible for us to "over count" listings by online agents for any significant time. As such, the data we produce is more likely to suffer from a sampling bias in favour of underestimation of online agents' market presence.
- Dataset in use — we are only looking at online estate agents in respect to sales and selling, and are excluding online letting agents and letting activities at this time. Many other sources blend both sales and letting data together.